Analysis of MarketWatch's October 15 close report, checked against NetApp's Q1 FY27 results and our own end-of-day price series.
NTAP FINANCE AI 2026-10-16
The tape: a company-specific underperformance day
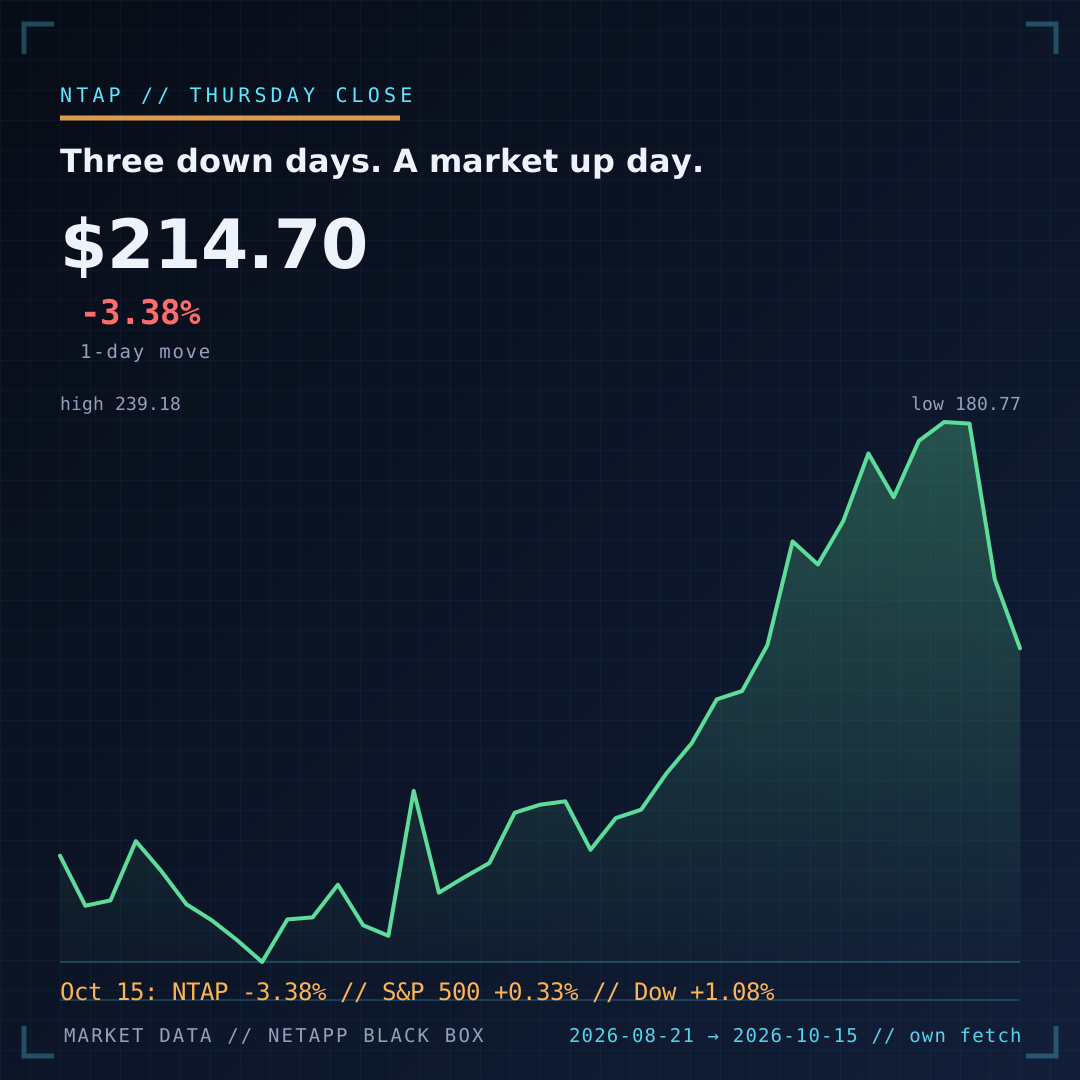
NetApp shares closed Thursday, October 15 at $214.70, down 3.38%. The S&P 500 rose 0.33% and the Dow rose 1.08%, making this relative underperformance rather than a broad down-market move. MarketWatch also counted it as NTAP's third consecutive losing session.
That describes the move; it does not explain it. The MarketWatch item supplies no company announcement, earnings revision or other catalyst. A responsible reading is therefore narrow: sellers were more aggressive in NTAP while the major indexes rose, but the article does not establish why.
The scale of the reversal
Our end-of-day series puts NTAP at $239.18 on October 12 and $214.70 on October 15: a 10.2% three-session decline. Even after that reversal, the stock remained about 19.2% above its September 2 close of $180.77, the last session before NetApp's Q1 FY27 results were reflected in regular trading. Those calculations are ours from the closing series, not figures stated by MarketWatch.
The useful interpretation is expectation compression. A falling share price does not itself show weaker storage demand; it shows that the price investors will pay for the available evidence has fallen. The financials hub keeps that distinction visible by separating reported operating results from market commentary.
The operating scorecard behind the stock
NetApp's latest reported quarter was strong. Q1 FY27 revenue reached $2.025 billion, up 30% year over year. Hybrid Cloud produced $1.819 billion, also up 30%, and Public Cloud produced a record $206 million, up 28%. Billings were $2.057 billion, up 36%.
Profitability did not expand at the same rate as revenue: GAAP gross profit of $1.419 billion on $2.025 billion of revenue implies a 70.1% GAAP gross margin, versus roughly 70.4% a year earlier. GAAP operating margin was 23.9% and non-GAAP operating margin was 31.9%. Cash generation was the counterweight: operating cash flow fell 25% to $503 million and free cash flow fell 35% to $401 million.
Guidance still asks for durable growth
Management guided Q2 FY27 revenue to $2.025–$2.175 billion, with 66.0–67.0% GAAP gross margin and 24.9–25.9% GAAP operating margin. Full-year revenue guidance was raised to $7.975–$8.225 billion, with 67.1–68.1% GAAP gross margin and 24.3–25.3% GAAP operating margin.
At the midpoint, full-year revenue guidance is $8.10 billion. The next financial checkpoint is therefore not Thursday's price action but whether revenue, margin and cash conversion stay consistent with that raised range.
AI is visible in products, but not reported as a revenue segment
The disclosed mix is Hybrid Cloud versus Public Cloud, not AI versus non-AI. NetApp did report record all-flash array revenue of $1.3 billion, up 47%, and tied its quarter to AI and hybrid multi-cloud initiatives. It also cited the DataPelago acquisition, StorageGRID 12.1, a Cisco AI collaboration and an SK Telecom proof of concept.
Those data points support an AI-infrastructure opportunity, but they do not quantify AI revenue, bookings or backlog. It would be wrong to treat all-flash revenue as an AI proxy: the category also serves databases, virtualization and other enterprise workloads. Our AI coverage tracks product and deployment evidence separately from financial disclosure.
What storage customers should read through
A volatile equity price does not change an ONTAP support matrix, an array's performance or a signed service agreement. It does sharpen the buyer's diligence list. For an AI proposal, ask the vendor to isolate the workload's required throughput, checkpoint window, small-file behavior, usable capacity, recovery objective and cost per useful terabyte rather than relying on the company-level growth story.
That work belongs in a measured design: establish baseline demand, model headroom and failure behavior, then validate it in a proof of concept. The capacity-planning guide provides the operational frame. For buyers, the signal that matters is whether the deployed system meets that model—not whether NTAP won or lost a trading session.
Bottom line
Thursday's move was notable because NTAP fell 3.38% while both cited market indexes rose, extending a three-day, 10.2% retreat. The financial baseline, however, remains record Q1 revenue, 30% growth, raised guidance and strong all-flash growth alongside lower cash flow and no separate AI-revenue disclosure. The stock move and the storage-demand evidence belong in the same analysis, but they are not the same fact.
Sources: MarketWatch close report · NetApp Q1 FY27 results. Market prices are from state/ntap_market.json, sourced from the Yahoo Finance chart API and rendered locally. Calculations are NetApp Black Box analysis. Not investment advice.