Finance NTAP Markets Oct 04, 2026
The move, measured against our own data
NetApp reported Q1 FY27 on September 2, 2026. NTAP closed that day at $180.77 in our price series. By September 29 it closed at $209.18, which is +15.7% — the basis for the “up about 16% since last earnings” framing. The move did not stop there.
In our most recent fetch (2026-10-04) NTAP’s last close was $226.27 on October 2, which is +25.2% from the September 2 close and roughly 2.4% below the 52-week high of $231.90. On the day, October 2 added +5.22% (from $215.05). Over the trailing windows in our series: +12.49% in five days, +25.17% in one month, +38.35% in three months and +124.25% year to date. The 52-week range is $93.69 to $231.90.
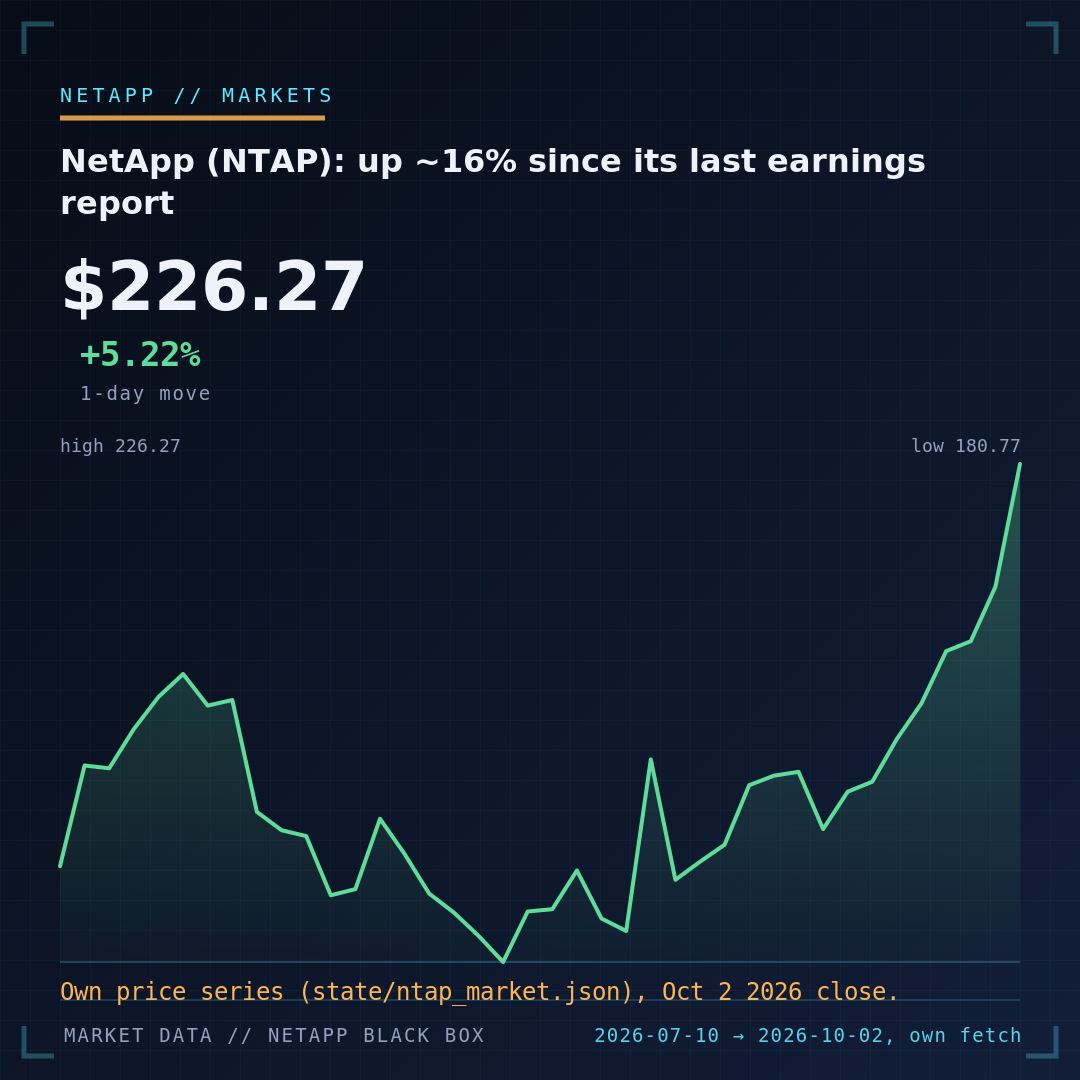
scripts/bbx_brand.py from state/ntap_market.json — no third-party chart screenshot.Read the tape plainly: most of the September rise happened after the report, and a further leg came at the start of October. A price move is a valuation signal, not a demand measurement — the stock can rise without any new ONTAP shipment figure being disclosed. Our separate look at the 66% non-GAAP EPS growth headline makes the same point about reading a single number in isolation.
What NetApp actually reported (Q1 FY27)
The operating numbers under the move are NetApp’s own, disclosed September 2:
- Net revenue $2.025B, up 30% year over year.
- Non-GAAP diluted EPS $2.58, up from $1.55 — a 66% increase.
- GAAP diluted EPS $1.88, up 63%; GAAP net income $375M, up 61%.
- All-flash array revenue $1.3B, up 47% — a record.
- Public cloud revenue $206M, up 28% — a record.
- Free cash flow $401M, down 35%; cash from operations $503M, down 25%.
Two things stand out for a storage professional. First, the all-flash line is the clearest demand signal NetApp publishes, and it grew faster than total revenue — consistent with a mix shift toward flash and, plausibly, toward AI-adjacent workloads, though NetApp does not break out AI-specific revenue. Second, the earnings growth and the cash-flow decline point in opposite directions; the “record EPS” and the weaker cash conversion belong in the same sentence.
The AI narrative that surrounds it
The move coincided with a dense run of NetApp announcements, all of which we covered as they landed — none of which is a revenue figure:
- NetApp Novus at INSIGHT 2026, a disaggregated AI-factory architecture that separates pNFS metadata from AFF A90 ONTAP data nodes. The first configuration is orderable; the 100 TB/s claim is an Omdia model, not a production benchmark — see our Novus analysis.
- The planned acquisition of Peak:AIO for scale-out parallel-NFS metadata technology.
- A recast FlexPod for AI with Cisco as validated, pretested AI infrastructure.
- A fully managed OCI NetApp Storage Service bringing ONTAP natively into Oracle Cloud, with GA planned within 12 months — the cloud/on-premises split is unpacked in our cloud & hybrid hub.
- AI Data Engine for discovering data where it already resides.
The announcement density is real and it is what the market reacts to. It is still not the same as booked revenue: NetApp has not disclosed AI-only revenue, AI gross margin, or an AI-specific backlog, and Novus’s marquee throughput number is a projection. Treating the headlines as demand would be reading past the disclosure.
What is not established
Three boundaries matter before anyone connects this chart to a workload decision:
- The trigger article was not readable from this host. The market write-up that asked the “why up 16%” question (Yahoo Finance) frames the move against AI-infrastructure momentum; its full text returned nothing usable to us at publication time, so we reproduce no analyst reasoning, no target and no quote from it. The numbers above are ours and NetApp’s, not theirs.
- A percentage move is not an AI revenue datapoint. There is no disclosed AI revenue line to move 16%.
- No forecast. Nothing here predicts where NTAP trades next; it describes what the series and the reported results already say.
What to watch next
- The next earnings report. Whether revenue and all-flash growth hold, and whether the cash-conversion gap narrows, is the real test of the operating story.
- Quantified AI wins. Any disclosure that separates AI revenue, attach rates or a backlog from the general pool — until then the AI line stays narrative.
- Product-consequence, not stock-consequence. For administrators the relevant question is not the share price but what changes on the arrays; the release-level view lives in our ONTAP release guide and the live market snapshot on the financials page.
Bottom line
The “up about 16% since last earnings” figure is arithmetically real — it matches the September 29 close against the September 2 post-earnings close in our own series — and by early October the stock had extended that move. Underneath it sits a genuinely strong quarter on revenue, all-flash growth and EPS, next to weakening cash conversion and a set of AI announcements whose financial size NetApp has not yet disclosed. Read the move as the market pricing a credible AI-infrastructure positioning story, not as evidence of AI revenue that nobody has published.
Trigger item (Yahoo Finance, via Google News) · Novus analysis · Q1 FY27 earnings breakdown · Financials