FINANCE NTAP MARKET MOVE 2026-10-31
state/ntap_market.json; no publisher chart is reproduced.The headline’s comparison is narrower than it sounds
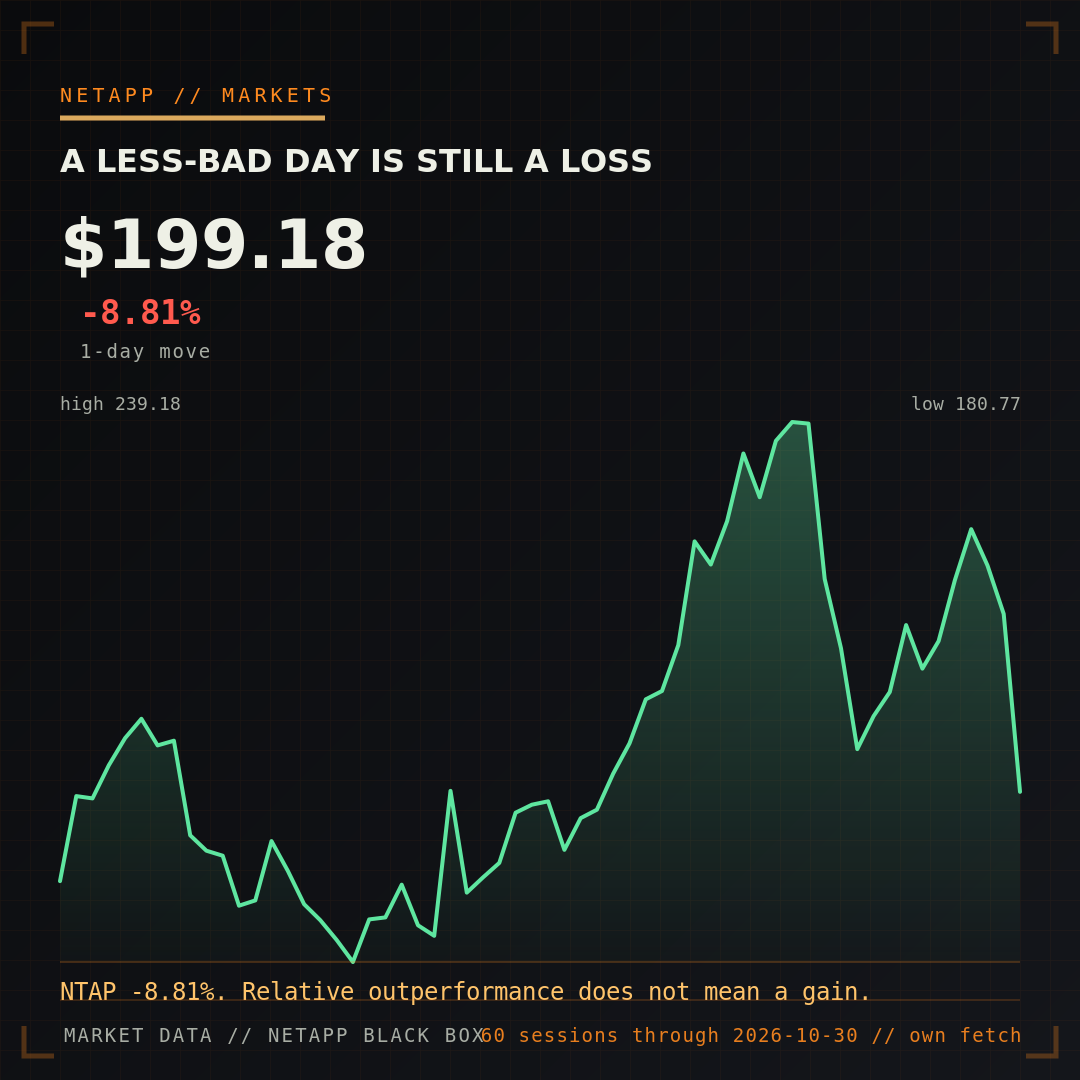
NTAP closed October 30 at $199.18, down $19.24, or 8.81%, from $218.42. It traded from $195.58 to $209.58 and volume was about 2.6 million shares. The close was 17.31% below the $240.87 52-week high. In plain terms, shareholders had a sharply negative day even if the selected comparison set fell further.
That distinction matters because relative outperformance can coexist with an absolute loss: a stock down 8.8% outperforms one down 9.5%. It does not mean NetApp gained, beat a business target or took market share. The comparison also does not isolate storage peers cleanly; automated recaps commonly mix adjacent infrastructure companies. Treat it as a session snapshot, not a competitive scorecard.
What drove the move remains unproven
The market series shows a 7.56% five-session decline and 7.38% one-month decline, but an 8.89% three-month gain and 79.81% year-to-date gain. That pattern is consistent with a high-valued infrastructure name repricing after a strong run, but it is not proof of why investors sold.
The source item reports price, peer and volume data; it does not cite an earnings release, guidance change, customer loss or product defect. Claims that component inflation, institutional selling or AI skepticism caused the move require separate evidence. None is supplied by this story, so the cause is unknown.
The operating numbers behind the ticker
NetApp’s latest filed quarter, Q1 FY27, reported $2.025 billion of revenue, up 30% year over year. Hybrid Cloud revenue was $1.819 billion, up 30%, and Public Cloud revenue was a record $206 million, up 28%. Product revenue was $987 million, support revenue $720 million, and professional and other services $112 million.
GAAP gross profit of $1.419 billion implies a 70.1% consolidated gross margin. GAAP operating margin was 23.9%; non-GAAP operating margin was 31.9%. Operating cash flow fell 25% to $503 million and free cash flow fell 35% to $401 million. Those cash figures are a useful counterweight to the strong revenue and margin headline.
Guidance, not one trading session, is the forward test
Management guided Q2 FY27 revenue to $2.025–$2.175 billion, GAAP gross margin to 66.0–67.0% and GAAP operating margin to 24.9–25.9%. Full-year guidance called for $7.975–$8.225 billion of revenue, 67.1–68.1% GAAP gross margin and $9.73–$10.03 of non-GAAP EPS.
The October 30 market recap contains no revision to those ranges. The next substantive read is whether revenue, product mix, gross margin and cash conversion track the company’s published guide—not whether NTAP ranked above a chosen peer group for one day.
AI demand is visible only through proxies
All-flash array revenue reached a record $1.309 billion, up 47% year over year. That is evidence of strong demand for high-performance data infrastructure, but not a disclosed AI revenue figure. NetApp does not report AI as a segment, and all-flash systems also support databases, virtualization, consolidation and other enterprise workloads.
Accordingly, the stock move says little by itself about AI-infrastructure demand. A firmer conclusion would need AI-specific bookings, capacity, customer counts or revenue—metrics absent from both the automated story and the filing. The responsible reading is that flash growth is strong while the AI mix remains undisclosed.
Read-through for storage customers
A one-day share move does not alter ONTAP behavior, support entitlement, upgrade requirements or data-protection design. Customers should not turn market volatility into an emergency infrastructure change. They should watch the business signals that can eventually reach operations: product availability, component pricing, support investment, roadmap delivery and consumption-contract economics.
For a practical baseline, use the first-day ONTAP checklist to preserve configuration evidence, verify health and establish recovery access. That makes operational decisions auditable regardless of the ticker. Procurement teams can separately test quotes, renewal terms and delivery dates against the company’s margin and supply commentary.
Bottom line
NTAP did not have a good October 30; it had a less-bad result than whatever selected peers underpins the automated headline. The useful fundamentals are $2.025 billion of quarterly revenue, a 70.1% GAAP gross margin, record all-flash revenue and weaker cash flow. None of the available evidence attributes the selloff or quantifies AI revenue, and nothing in the session changes how customers should operate ONTAP.
Sources: MarketWatch item via Google News · NetApp Q1 FY27 results · NetApp Form 10-Q. Price returns and the gross-margin calculation are NetApp Black Box analysis from the cited inputs and state/ntap_market.json. Not investment advice.