FINANCE NTAP BENCHMARKS 2026-11-03
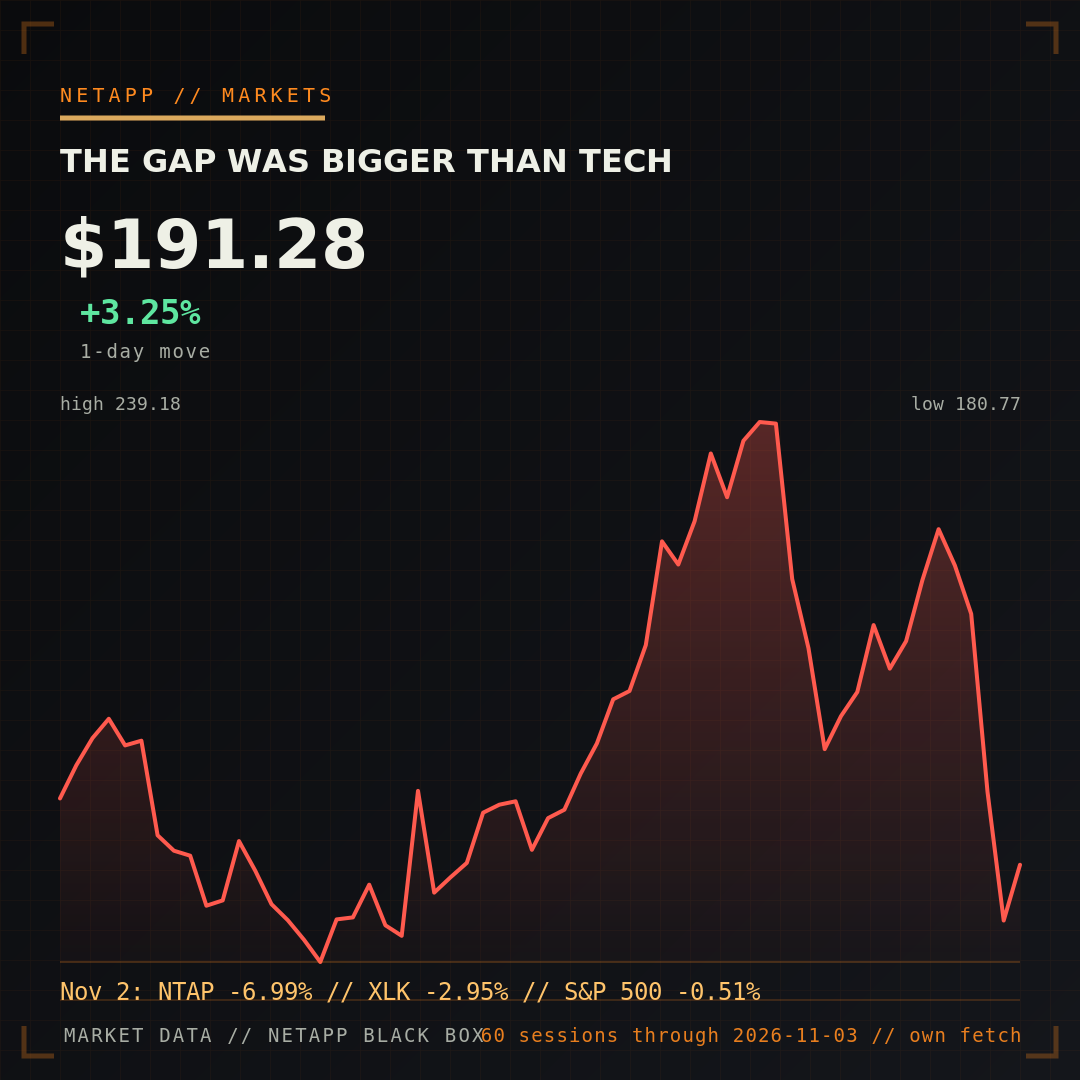
state/ntap_market.json; no publisher chart is reproduced. The final point includes Tuesday’s partial rebound.The benchmark ladder
NTAP closed November 2 at $185.26, down 6.99% from $199.18. Independently fetched Yahoo Finance closes put the same session at −0.51% for the S&P 500, −1.07% for the Nasdaq Composite and −2.95% for the Technology Select Sector SPDR Fund (XLK). NetApp therefore lagged those three reference points by 6.48, 5.92 and 4.04 percentage points, respectively.
That ladder matters because it separates a broad risk-off session from additional company-specific repricing. It does not reveal the cause of the extra decline. The syndicated headline offers a market comparison, not evidence of an earnings revision, customer loss or product failure.
Tuesday recovered only part of the drop
NTAP closed November 3 at $191.28, up 3.25%. The rebound recovered $6.02 of Monday’s $13.92 loss, or 43.2% of the dollar decline. The stock remained 3.97% below its October 30 close and 12.42% below its October 29 close.
The two-way move is a useful warning against narrating one close as a business verdict. For a durable view, the site’s NetApp financial snapshot keeps the current market observation alongside reported operating data.
The operating scorecard
NetApp’s latest filed quarter, Q1 FY27, reported $2.025 billion of revenue, up 30% year over year. Hybrid Cloud revenue was $1.819 billion, up 30%, and Public Cloud revenue was $206 million, up 28%. Product, support, and professional and other services revenue were $987 million, $720 million and $112 million.
GAAP gross profit of $1.419 billion implies a 70.1% consolidated gross margin. GAAP operating margin was 23.9%; non-GAAP operating margin was 31.9%. The counter-signal is cash conversion: operating cash flow fell 25% to $503 million and free cash flow fell 35% to $401 million.
Guidance, not the benchmark gap, is the forward test
Management guided Q2 FY27 revenue to $2.025–$2.175 billion, GAAP gross margin to 66.0–67.0% and GAAP operating margin to 24.9–25.9%. Full-year guidance called for $7.975–$8.225 billion of revenue, a 67.1–68.1% GAAP gross margin and $9.73–$10.03 of non-GAAP EPS.
The market recap supplied no guidance revision. Future results against those ranges, plus cash conversion and product mix, can test the business thesis; Monday’s relative loss cannot.
AI demand: a strong proxy with a hard limit
All-flash array revenue reached a record $1.309 billion, up 47% year over year. That is evidence of demand for performance-oriented data infrastructure, but it is not an AI revenue line. All-flash systems also serve databases, virtualization and consolidation, and NetApp does not report AI as a segment.
Neither Monday’s fall nor Tuesday’s rebound establishes a change in AI-infrastructure demand. That conclusion would require AI-specific bookings, capacity or revenue that the filing does not provide. For architecture work, the FlexPod design guide is more actionable than price attribution: it ties compute, network and storage choices to a supported design.
Read-through for storage customers
A benchmark gap does not change ONTAP behavior, support entitlement, recovery objectives or upgrade prerequisites. Customers should watch evidence that can reach operations: quotes and renewals, lead times, support staffing, release delivery and consumption-contract terms.
Keep technical decisions tied to measured requirements and supported software. The ONTAP release guide provides lifecycle and upgrade context that remains valid through market volatility.
Bottom line
NTAP’s 6.99% Monday loss was materially worse than the broad market and the technology benchmark, and Tuesday recovered less than half of the dollar decline. That quantifies the repricing; it does not explain it. Revenue, margins, guidance, all-flash mix and cash conversion are the better tests of the operating story.
Sources: Yahoo Finance Singapore item via Google News · NetApp Q1 FY27 results · NetApp Form 10-Q. NTAP returns come from state/ntap_market.json; S&P 500, Nasdaq and XLK comparisons are NetApp Black Box calculations from independently fetched Yahoo Finance closes. Not investment advice.