FINANCE NTAP RETURNS 2026-11-05
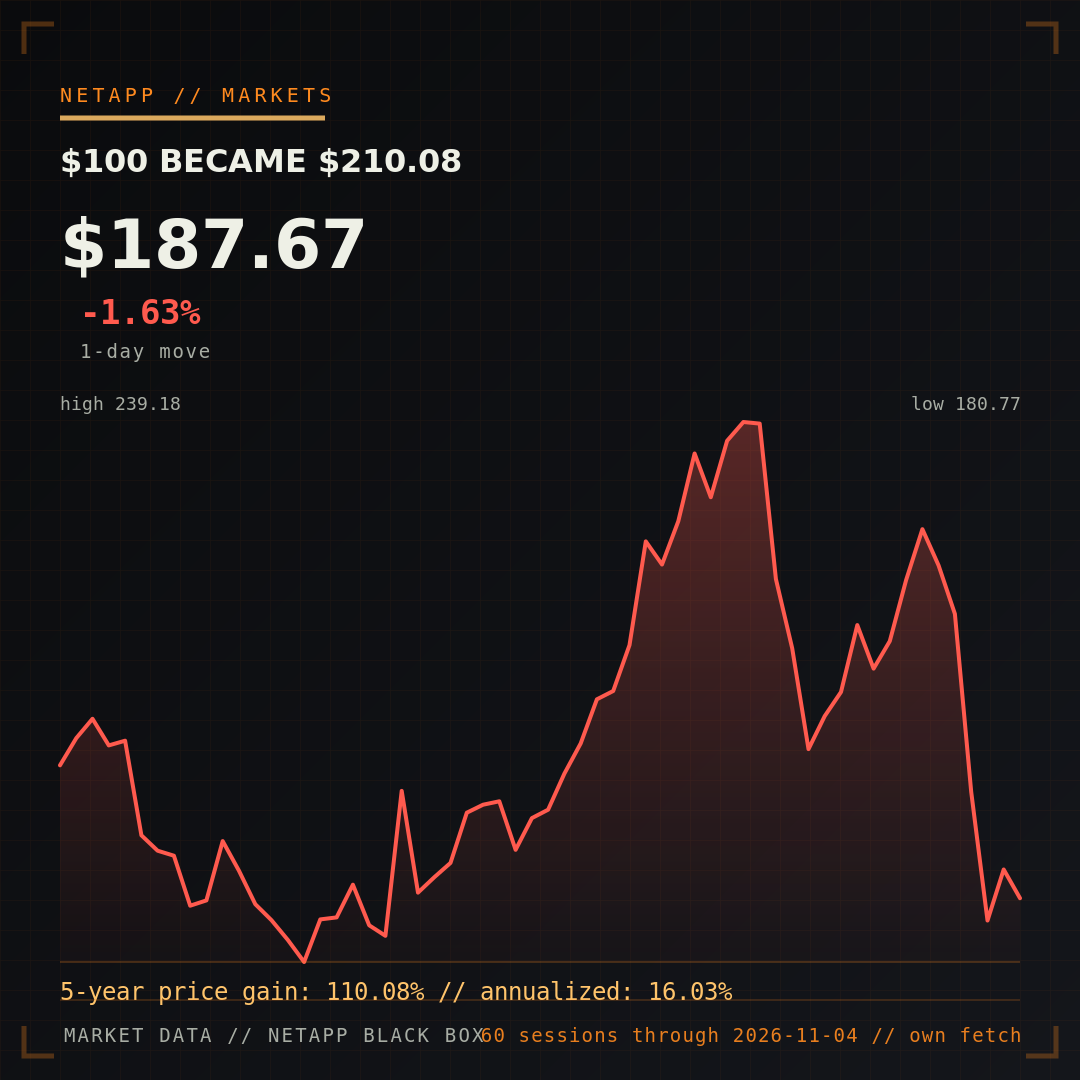
state/ntap_market.json. It provides current price context; it is not presented as a five-year series and no publisher chart is reproduced.Reproducing the $210.08 headline
Benzinga says a $100 NTAP investment five years earlier would have been worth $210.08 at its quoted $190.00 share price. Those inputs imply a starting price near $90.44: $100 buys about 1.1057 shares, and those shares at $190 are worth $210.08. The ending value is a 110.08% price gain, equivalent to roughly 16.03% compounded annually, matching the publisher’s stated average annual return.
The figure is timestamp-sensitive. The site’s independent market snapshot closed November 4 at $187.67, below the publisher’s intraday reference. Holding the implied starting price constant, that close would put the same price-only illustration near $207.50. The difference is normal quote movement, not a contradiction.
What the calculation leaves out
The article describes a price-based illustration and does not specify dividend reinvestment, taxes, fees, trade timing or fractional-share rules. NetApp has paid cash dividends during the period, so the number should not be relabelled as a fully specified total return. It also carries survivorship and endpoint risk: moving either date changes the result.
That distinction matters for readers comparing the headline with a brokerage statement. Use consistent dates and an explicit dividend policy before treating two return figures as comparable. This article is analysis, not investment advice.
The operating scorecard behind the shares
NetApp’s latest reported quarter, Q1 FY27, delivered $2.025 billion of revenue, up 30% year over year. Hybrid Cloud revenue was $1.819 billion, up 30%, while Public Cloud revenue was $206 million, up 28%. All-flash array revenue reached a record $1.309 billion, up 47%.
GAAP gross profit of $1.419 billion implies a 70.1% gross margin. GAAP operating margin was 23.9%, and non-GAAP operating margin was 31.9%. The counterweight was cash conversion: operating cash flow declined 25% to $503 million and free cash flow declined 35% to $401 million.
Guidance is the forward test
Management guided Q2 FY27 revenue to $2.025–$2.175 billion, GAAP gross margin to 66.0–67.0% and GAAP operating margin to 24.9–25.9%. Full-year revenue guidance was $7.975–$8.225 billion, with GAAP gross margin of 67.1–68.1% and non-GAAP EPS of $9.73–$10.03.
The five-year return cannot tell readers whether NetApp will meet those ranges. Reported revenue, mix, margins and cash flow are the evidence that can update the forward business case. The NetApp financial snapshot keeps those measures beside the current market observation.
AI demand: signal, not a disclosed segment
Record all-flash revenue and 30% Hybrid Cloud growth are consistent with strong demand for performance-oriented data infrastructure. They do not isolate AI demand. NetApp does not report an AI revenue segment, and all-flash systems also serve databases, virtualization and consolidation.
The filing says NetApp is focused on accelerating AI adoption, and the quarter included the DataPelago acquisition. That supports the strategic direction, but it does not convert the five-year share return—or the entire all-flash line—into an AI-demand measure. AI-specific bookings or revenue would be needed for that claim.
Read-through for storage customers
The useful customer signal is the scale of current investment and product demand, not the hypothetical portfolio value. Strong revenue and all-flash growth can support continued engineering and ecosystem work; neither guarantees a particular release, price or support outcome.
Keep purchasing and upgrade decisions tied to workload measurements, supported configurations, lifecycle dates and contract terms. The ONTAP release guide covers the operational decision path, while the FlexPod design guide connects AI and high-throughput requirements to a validated architecture.
Bottom line
Benzinga’s $210.08 result is arithmetically consistent with its $190 quote and 16.03% annualized return. It is best read as a price-return snapshot, not a total-return statement or an AI-demand forecast. The durable evidence is NetApp’s reported growth, margin structure, guidance and cash conversion.
Sources: Benzinga’s November 4 return illustration · NetApp Q1 FY27 results · NetApp Form 10-Q. Return reconciliation is NetApp Black Box analysis from the publisher’s stated inputs; the current quote comes from state/ntap_market.json.