Home / Troubleshooting / Performance Analysis
Performance Analysis
"It's slow" is where every performance case starts. The job is to find the bottleneck: client, network, node CPU, disk, or a specific volume/QoS limit.
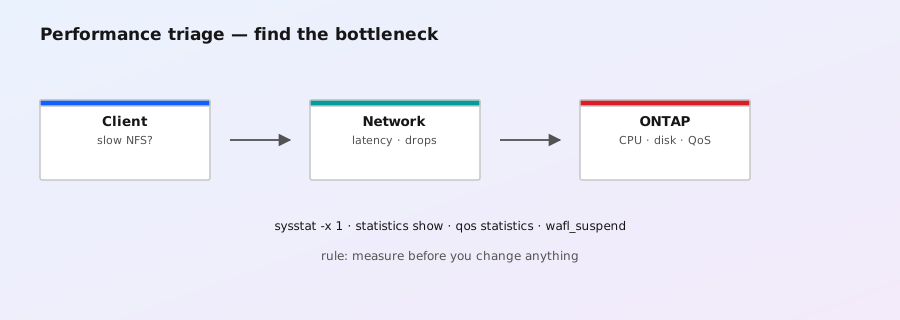
1. Method: narrow it down first
- Who is slow? One client, one VM, one volume, or everything? Everything → look at node/network. One thing → look at that volume/LIF/QoS.
- Is it latency or throughput? High latency + low ops = queueing (disk, CPU, or network). High throughput at expected latency = the workload is just big.
- Since when? Correlate with changes: new snapshot policy, dedupe scan, backup window, takeover in progress, added volume, QoS policy.
- Check the cheap things first: HA takeover in progress? Disk failed? Aggregate nearly full? Network errors?
2. The 60-second health check
# Node CPU/ops overview, 10 samples, 1s apart (nodeshell)
system node run -node node1 -command sysstat -M 1 10
# Extended: per-protocol ops and more detail
system node run -node node1 -command sysstat -x -M 1 5
# HA state — is a takeover in progress?
storage failover show
# Hardware health
system health alert show
# Events around the start of the problem
event log show -severity ERROR -time ">now-24h"
sysstat -M columns to watch: CPU (busy%), Ops/s, Disk util per aggregate (95%+ = disk-bound), Net kB/s, Cache hit (low on AFF = red flag). If CPU is idle and disk util is low, the bottleneck is client- or network-side.
3. Per-volume latency: who is the hot volume?
# QoS statistics: latency + throughput per volume (5s samples)
qos statistics volume show -interval 5
# Focus on one SVM/volume
qos statistics volume show -vserver vs1 -volume vol1 -interval 5
# Wait, then stop
statistics start -sample-id perf -object system:node
statistics show -sample-id perf -object system:node -counter cpu_busy,disk_busy
statistics stop -sample-id perf
If one volume shows high read/write latency while others are fine, drill into it: snapshot activity, dedupe scan, high QoS utilization, or a client storm. If all volumes are slow, the node or disk layer is the problem.
4. Finding the bottleneck layer
| Observation | Bottleneck | Check |
|---|---|---|
| CPU ~100%, disk util low | Node CPU (protocol processing, efficiency) | Dedupe/compaction running? volume efficiency show; heavy NFS ops; check for scanning jobs |
| Disk util 95%+, queueing | Disk/aggregate | Which aggregate: sysstat -M column; move volumes or add disks |
| CPU and disk fine, client slow | Network or client | network ping-lif, port stats, client-side tests (iperf, fio) |
| Single volume slow, others fine | Volume-level | QoS policy hit? Snapshot autodelete churn? Volume nearly full? |
| High write latency, low ops | NVRAM or sync issues | HA partner health, interconnect errors, storage failover show |
5. Efficiency jobs vs. performance
Post-process dedupe and compaction scans consume CPU and can add latency while running — especially on large, busy volumes. Check:
# Is an efficiency scan running, and when is the next?
volume efficiency show -volume vol1
# Reschedule to off-peak if needed
volume efficiency modify -volume vol1 -schedule sun-sat@2:00
6. Snapshot delete storms
Deleting a large snapshot can hammer disk I/O for a while (blocks are freed in the background). If you see high disk util and a big snapshot was just deleted/autodeleted, wait it out — or use snapshot delete -foreground false planning to avoid the peak.
7. QoS: is a policy throttling you?
# Volumes with QoS, and current utilization against the limit
qos statistics volume show -fields volume,qos-policy-group,latency,iops,throughput
qos policy-group show
# Check if a volume is hitting its ceiling
qos statistics volume show -vserver vs1 -volume vol1 -interval 5
If throughput is pinned exactly at the policy limit, the QoS ceiling is your bottleneck — raise it or split the workload. For the complete policy-group toolkit (ceilings, floors, adaptive IOPS-per-TB groups, monitoring counters), see our ONTAP QoS policy groups guide.
8. Mini case: "all NFS clients are slow"
storage failover show                        # (a) takeover in progress?
system node run -node node1 -command sysstat -M 1 10   # (b) CPU/disk
qos statistics volume show -interval 5      # (c) which volume?
network ping-lif -vserver vs1 -lif data1     # (d) LIF reachable?
event log show -severity ERROR -time ">now-1h"  # (e) anything logged?
Work through a→e in order. In the field, the answer is usually (a) someone took over a node for maintenance and forgot, (b) an efficiency scan + backup window collided, or (c) one chatty volume with a too-small QoS ceiling.
sysstat -M (node-level), qos statistics volume show (volume-level), event log show (events), and client-side nfsstat/iostat cover 90% of cases. For deep dives, NetApp support uses AutoSupport logs — send them early if you suspect firmware/software defects.